THE BATTING LAB

Logo for the Webby Awards featuring a stylized white trophy on the left and the text "The Webby Awards" in white letters on a black background.
Black background with a white circular logo featuring the stylized letters A, D, and C.
Black and white logo with the text 'The Future of Privacy Forum' and a stylized eye symbol.
Cannes Lions logo with stylized lion graphic and bold text on black background.
Black background with the word 'effie' in large white lowercase letters; a stylized white hand making a fist is partially visible in the upper left corner.

More than half of American kids play baseball or softball, but fewer than half grasp the basics of data. And while less than 1% will ever play professionally, by 2030 the most valuable career skill will be the ability to read and analyze data. To prepare kids for the future, SAS tapped into their passion for the game and secretly pitched them on data literacy with The Batting Lab, an AI-powered batting cage that tracks swings, body position, and ball-flight stats, helping players sharpen both their performance and their data literacy.

Hardware at Clios, ADC, Effies, Webbies, and Shorties. Shortlisted at Cannes. D&AD, and AICP Next.

Cage design by obj. UI by VOLVOX.

Using cameras, sensors, AI, computer vision, and IoT analytics, swing analysis happened in real time. The Batting Lab delivered instant feedback to help each kid refine their swing. To truly improve at the plate, they had to dive into the numbers.

HOW IT WORKED

The Batting Lab was covered by The Today Show, Muse by Clio, Adweek Ad of the Day, Shots Ad of the Day, LBB Online, CBS, CNET, and more. The program improved SAS' innovation perceptions by 285%, consideration by 399%, and recommendation by 258%.

PRESS & RESULTS

In the first session, The Batting Lab analyzed every swing, projecting the data onto a screen in real time to guide players toward optimal form. After 12 sessions, the little leaguers had not only improved their swings but also deepened their understanding of data.

SESSIONs

A woman in white and purple sportswear swinging a golf club on a stage with a curved LED screen in the background.

SESSION 1 - MADDIE

Close-up of a chart or thermometer with blue dots indicating a range within the 70s to 100s, and an vertical bar with labels 'OLDEST' at the top and 'RECENT' at the bottom, possibly representing data over time.
A young person is on stage holding a baseball bat, preparing to hit a baseball during a sports demonstration or event.

SESSION 12 - MADDIE

Graph showing the ideal temperature range for aging, with blue data points plotted within the range as indicated by the colored zones and a label for the ideal range.
A child wearing a baseball helmet and white shirt practicing batting with a bat inside an indoor simulation or entertainment center.

SESSION 1 - DREW

A diagram showing a person's side profile with measurements of the chest, arm length, and hand position during a swing, including distances from the foot to the hand, labeled in inches.
Child wearing a baseball uniform and helmet, holding a bat, in a batting stance in front of a baseball stadium.

SESSION 12 - DREW

A diagram demonstrating the measurements and shape of a human foot, showing angles and distances from the ankle to the toes, with a prosthetic limb attached to the foot.

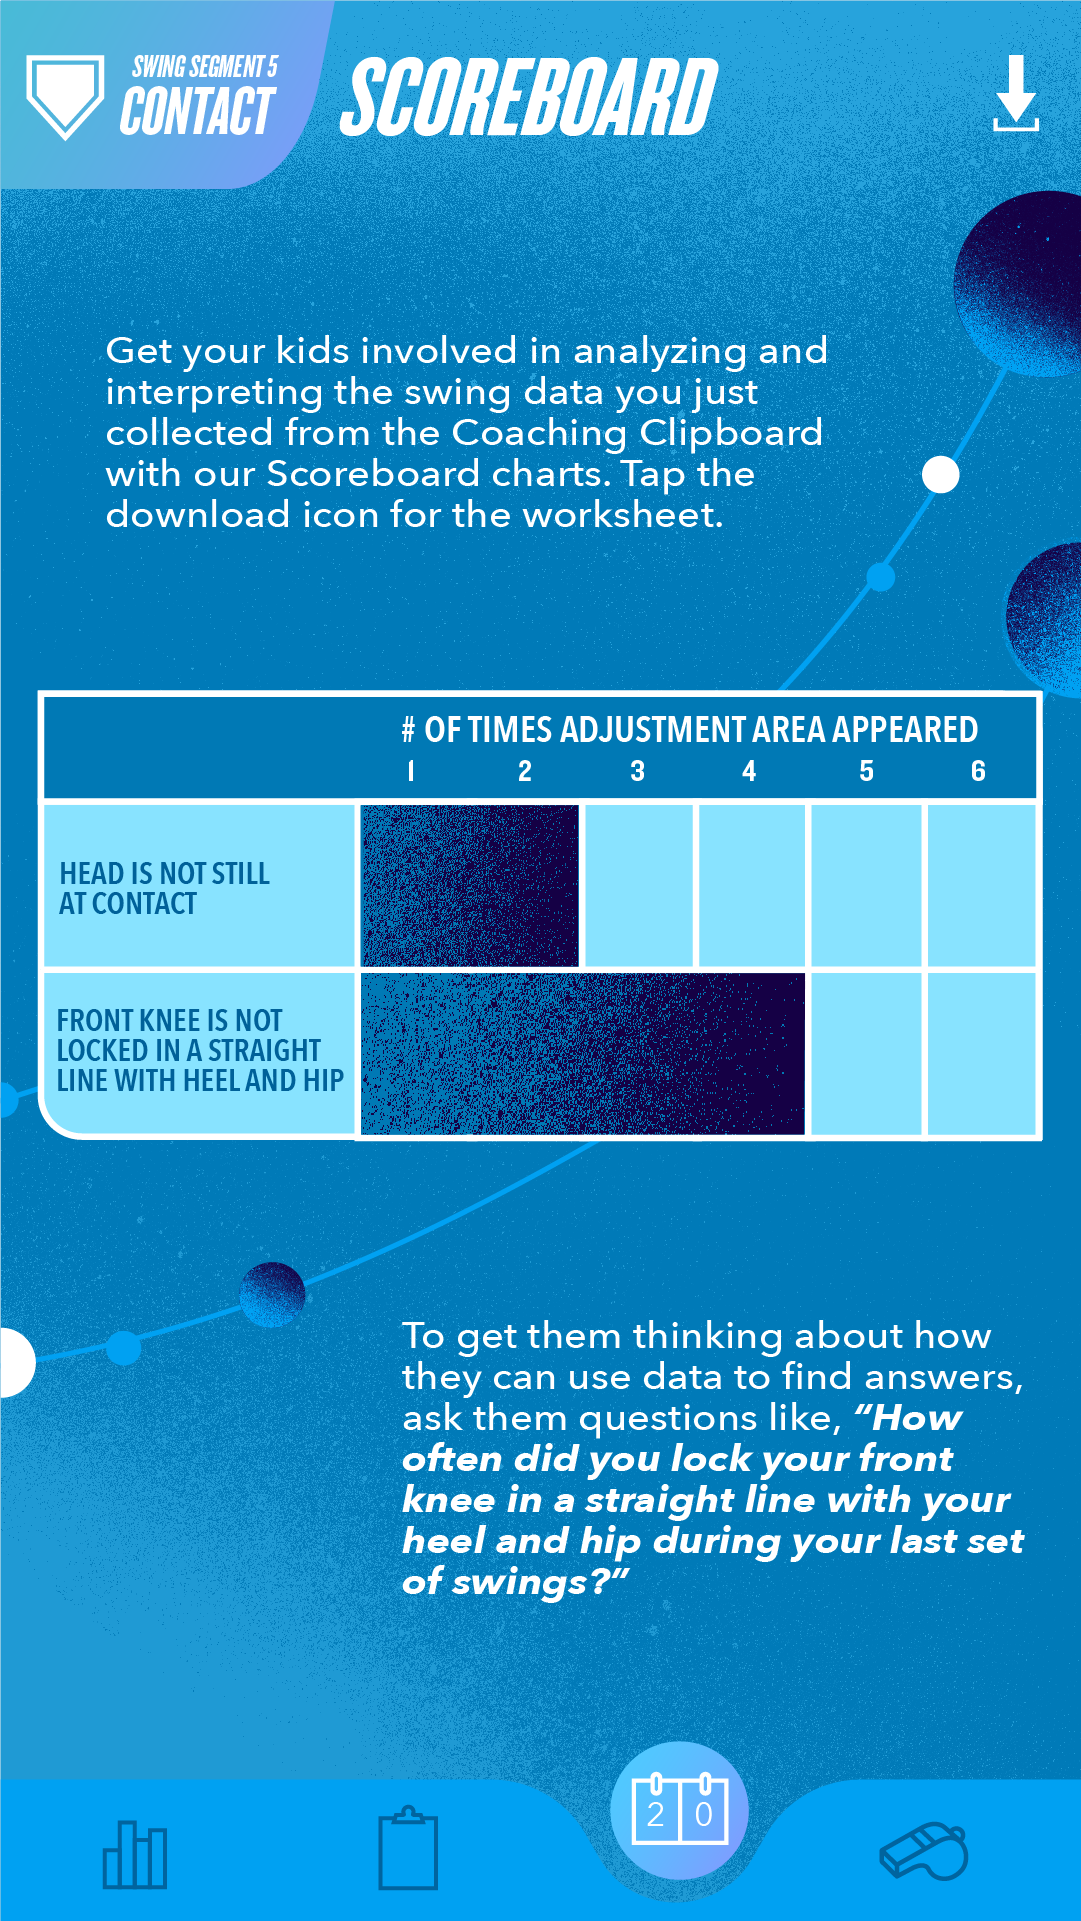
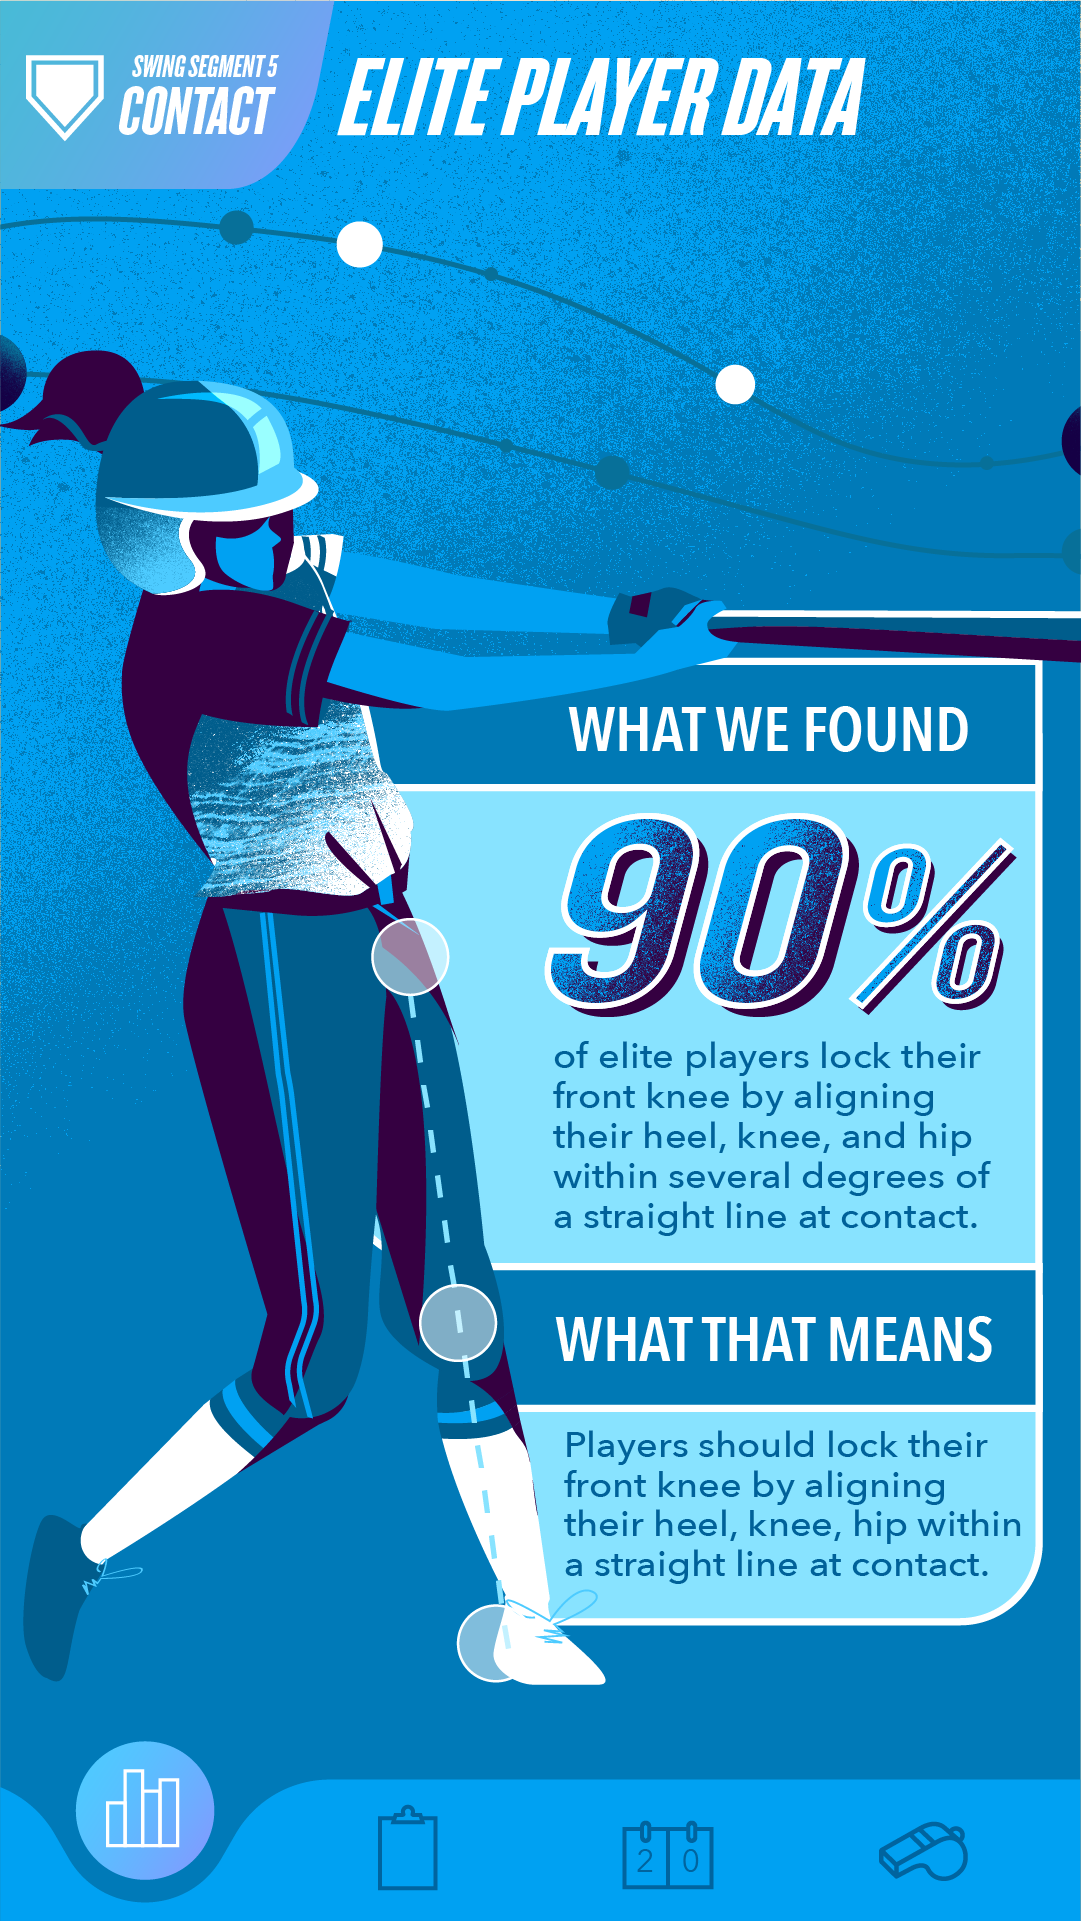
To extend the program to other little leaguers, we created the Data Playbook, a free educational tool for players, coaches, and parents.

DATA PLAYBOOK EXTENSION

Illustration of a female baseball player in uniform holding a bat in a batting stance, with a book or towel on the ground in front of her, demonstrating a drill for contact practice.
Cover of a book titled 'Data Playbook' by The Betting Lab, featuring an animated baseball player wearing a helmet and holding a baseball bat, set against a blue background with the SAS logo in the bottom left corner.
Digital illustration of a female baseball player preparing to swing a bat, wearing a helmet and sports attire, with instructions to repeat a combo attack five times at normal speed, labeled as step 8 in a sports training guide.
An illustration of a person practicing a golf swing with a golf club, wearing a helmet, gloves, and athletic clothing, on a blue background with instructional text for a golf drill.
A colorful infographic about analyzing golf swing data with a scoreboard chart showing the number of times certain adjustments were made, and encouraging questions for better understanding.
Infographic about elite golfer contact point data, showing a female golfer in profile with her front knee, heel, knee, and hip aligned on a straight line at contact, indicating 90% of elite players do this.

North America CCO: Sean Bryan
CCO: Shayne Millington, Pierre Lipton
ECD: Mat Bisher, Jason Ashlock, Dominick Baccollo
GCD: Daniel Kim, Justin Chen, Annie Elliott
ACD: Kassandra Pollard
AD/CW: Gabby Gonzaga, Kayla Andersen
Designers: David Mashburn, Ethan Buller, Herman Awuku
Producers: Christine Lane, Mihae Mukaida, Jeannette Subero, Chris Badano, Kelly Krincek